
For Bruker AFMs, these 8 new Ringing Mode™ data channels are obtained simultaneously with the 6 PeakForce QNM® channels. Together, this expands the total available channels to 14 different data types and provides a very rich data set.

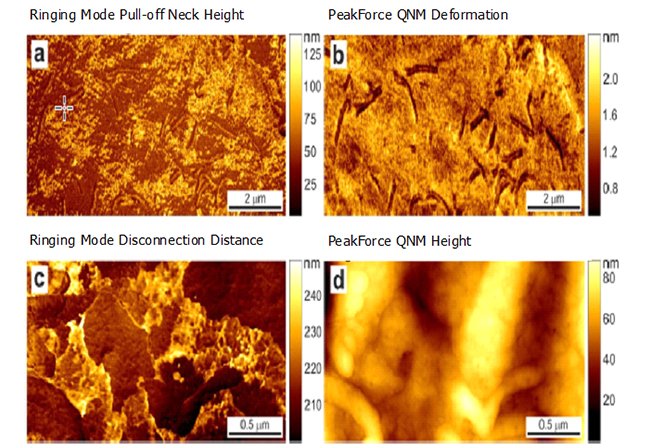
 Physical channels independently showing substantial differences between these two measurements on a PS/LDPE sample. Non-uniform detachment as molecules break free from tip (difference between E & F after cantilever goes through max downward deflection, ringing does not begin yet. By making this distinction, RM detects the subtle difference)
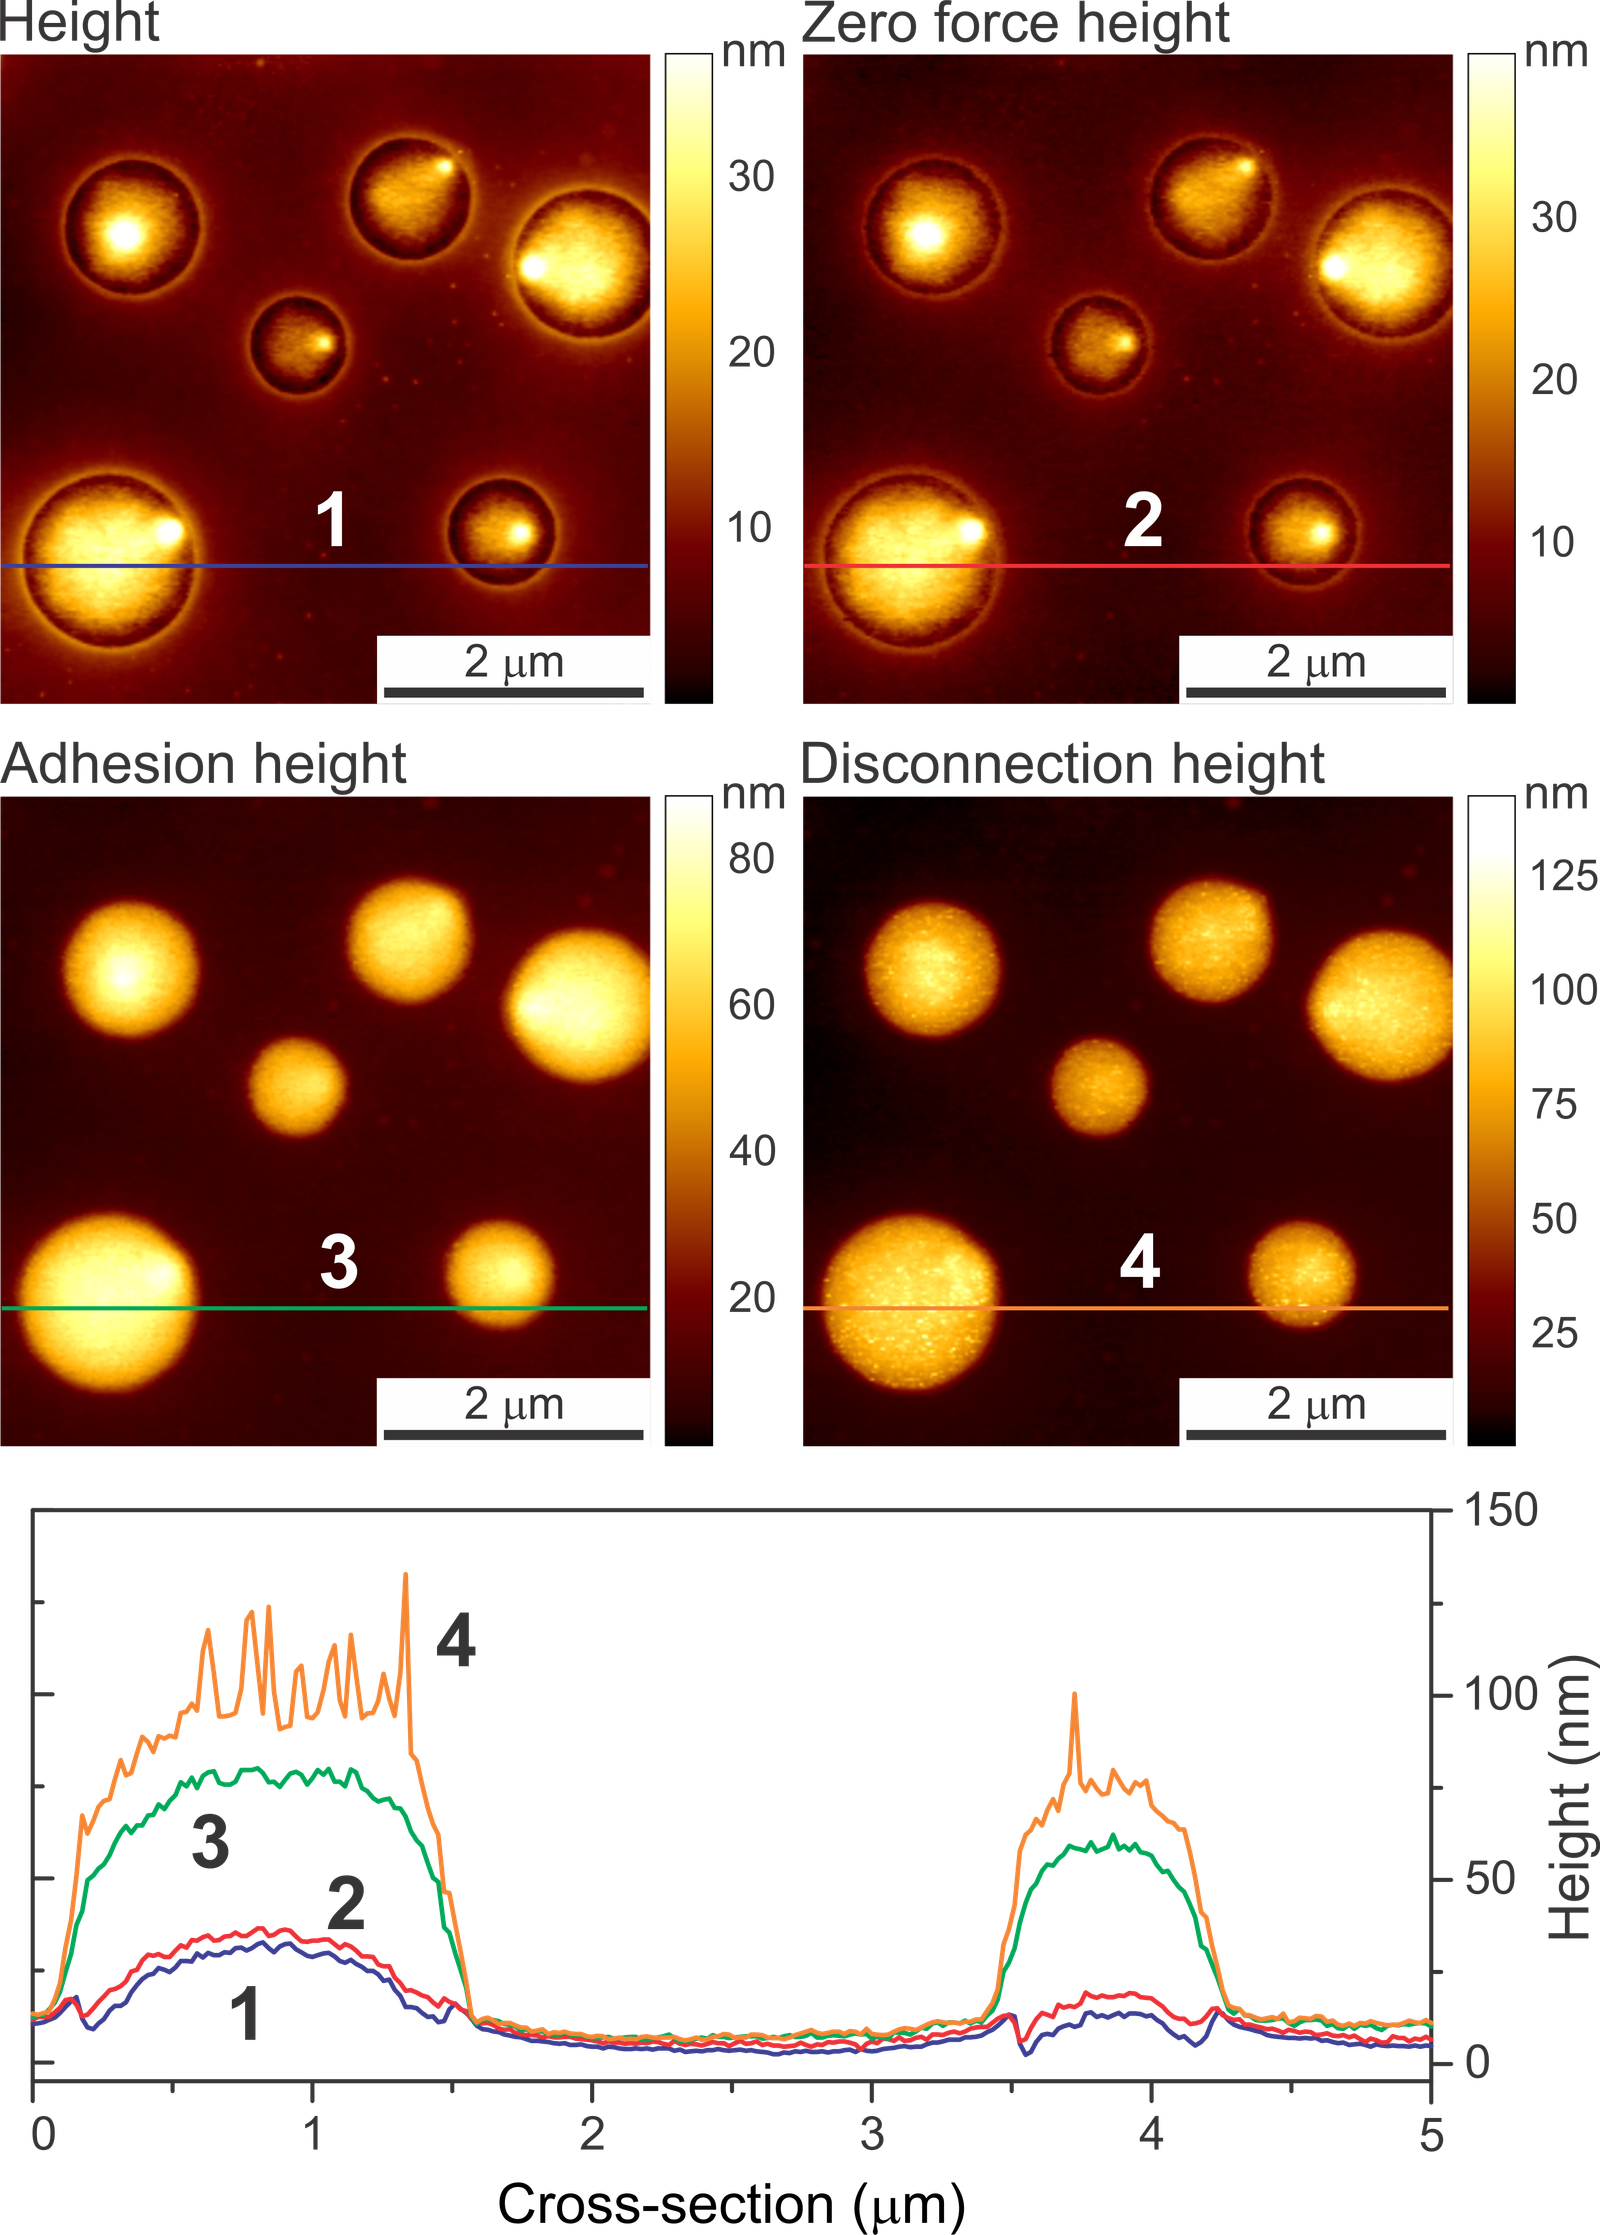 Figure 3
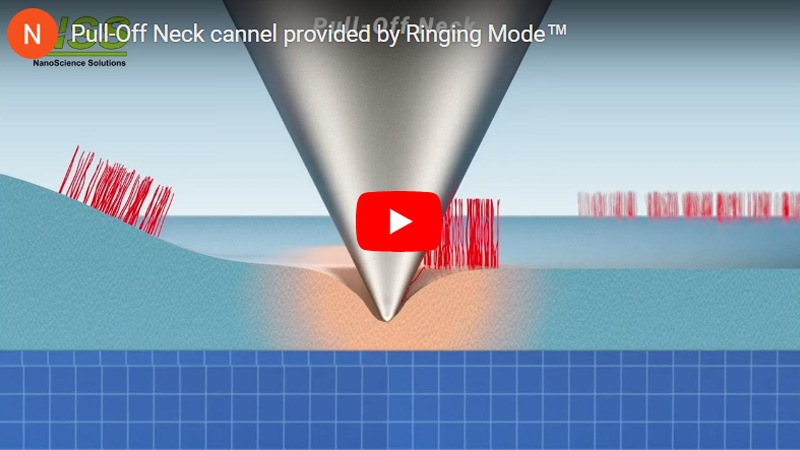
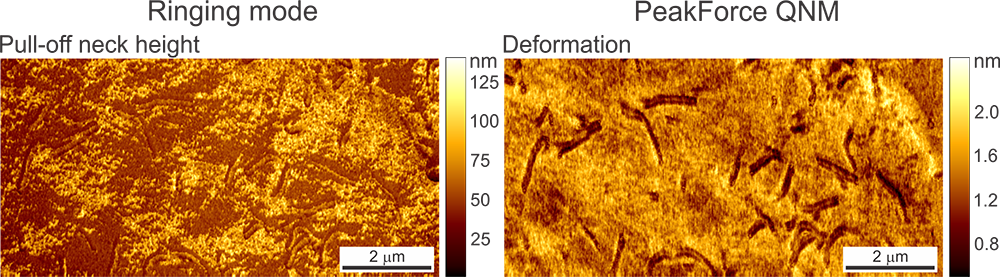 Images obtained on a human melanoma cell. Bright areas in the Pull-off Neck Size data channel indicate areas of the cell membrane that form a longer, more stable neck between the AFM tip during pull-off.
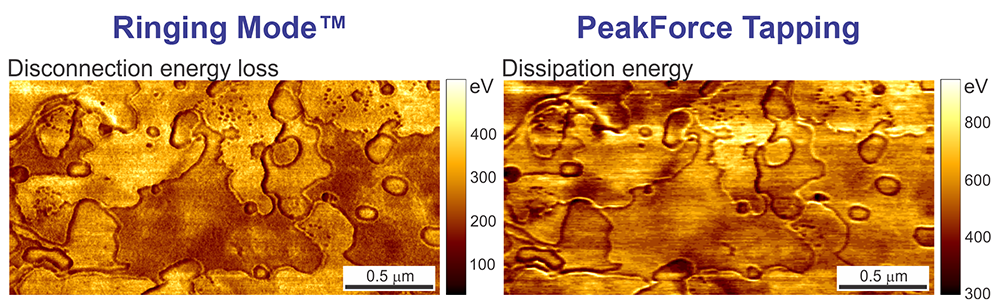
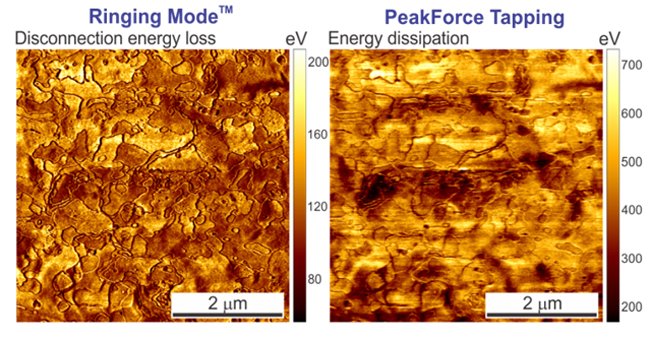
 The images below depict the disconnection energy loss measured on a sample of corneocytes as well as the regular energy dissipation channel from PeakForce QNM measured on the same sample. One can see a substantial difference between these two images. PeakForce QNM Dissipation Energy provides the sum of all energy contributions during interaction of the AFM with the sample surface. This includes energy dissipated due to (1) the adhesion energy, (2) the energy due to the viscous response of the sample material during the contact deformation, and finally, (3) the disconnection energy loss. Ringing Mode separately measures Disconnection Energy Loss.
 Examples of the new data channels
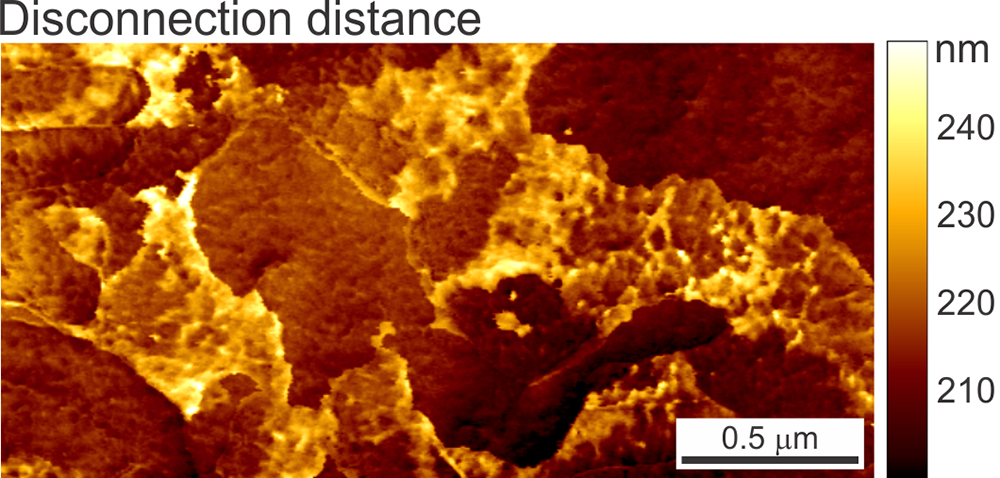
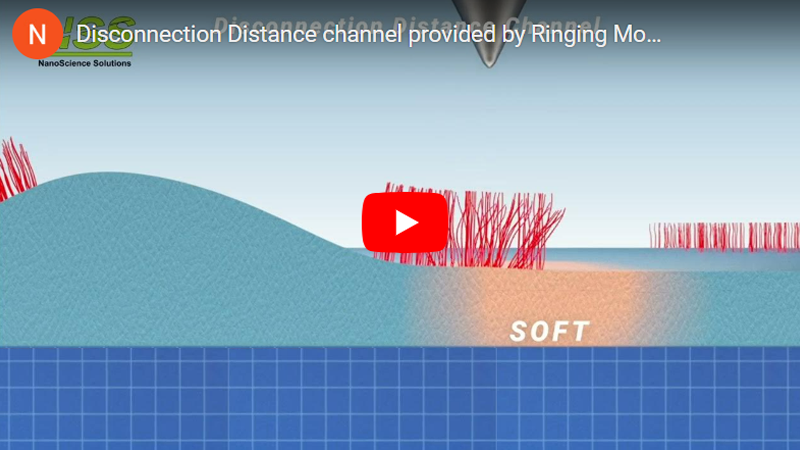
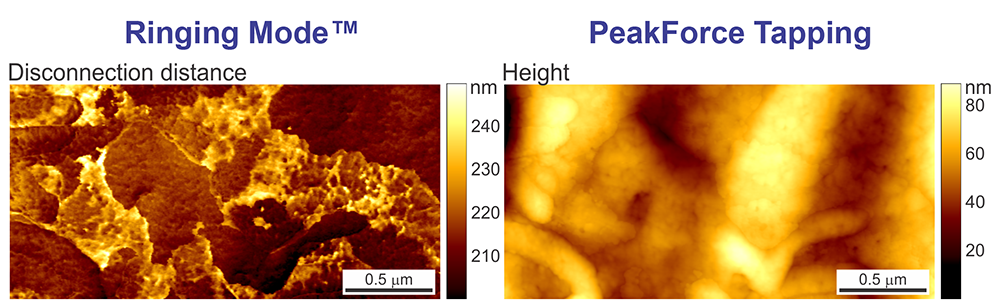
A principally new imaging channel of the Ringing Mode™ — disconnection distance. The cell height is shown as a reference (simultaneously recorded in PeakForce Tapping® mode). The scan rate is 0.5 Hz. An example of a human melanoma cell is shown.
Examples of the new data channels
A principally new imaging channel of the Ringing Mode™ — disconnection distance. The cell height is shown as a reference (simultaneously recorded in PeakForce Tapping® mode). The scan rate is 0.5 Hz. An example of a human melanoma cell is shown.
Disconnection distance
 The human skin flake sample imaged at 1 Hz (1 sec per line). The disconnection energy loss (the energy loss during the separation of the AFM probe from the sample surface) and the dissipation energy (imaged using PeakForce Tapping®) are shown.
Disconnection energy loss
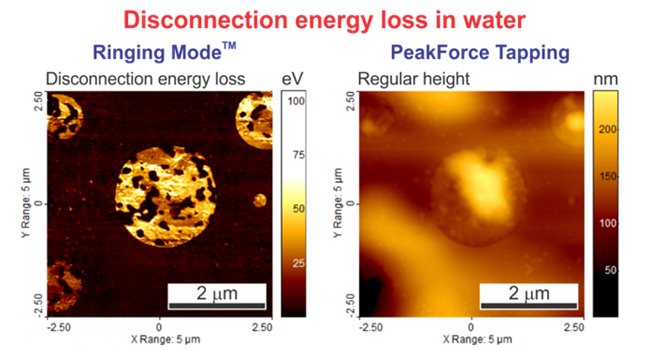
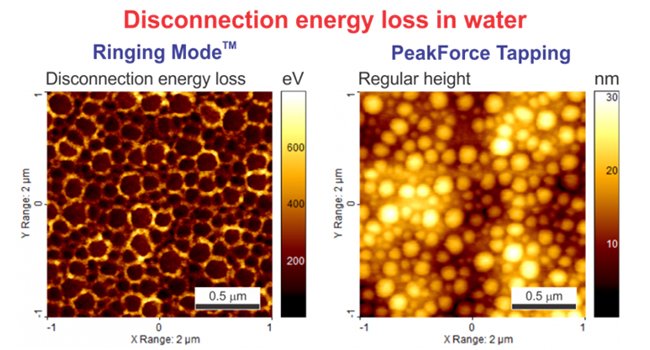
A few examples of scanning in water
LDPE/PS blend in water:
The surface of polystyrene in water:
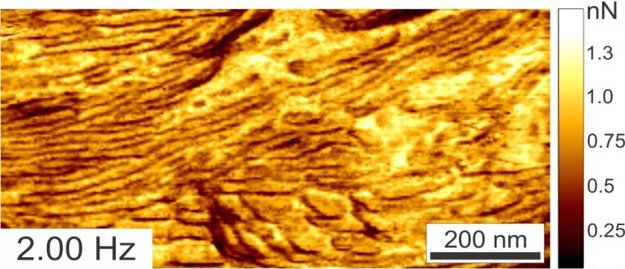
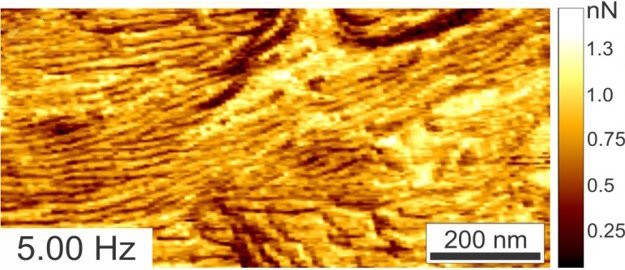
RM can go faster than regular/standard resonant tapping mode and also provides new information channels/data lacking in TM. A two-polymer blend is imaged in Ringing Mode™ below at scan speeds ranging from 0.25 Hz to 5Hz. Even at increased scan rates, the adhesion images remain artifact-free. These adhesion data channel types are not available with standard resonant tapping modes.
Compared to existing state of art AFM technology, Ringing Mode™ enables substantially higher resolution imaging of the surface of soft samples. This is due to minimization of tip-sample contact size that happens at the disconnection point.
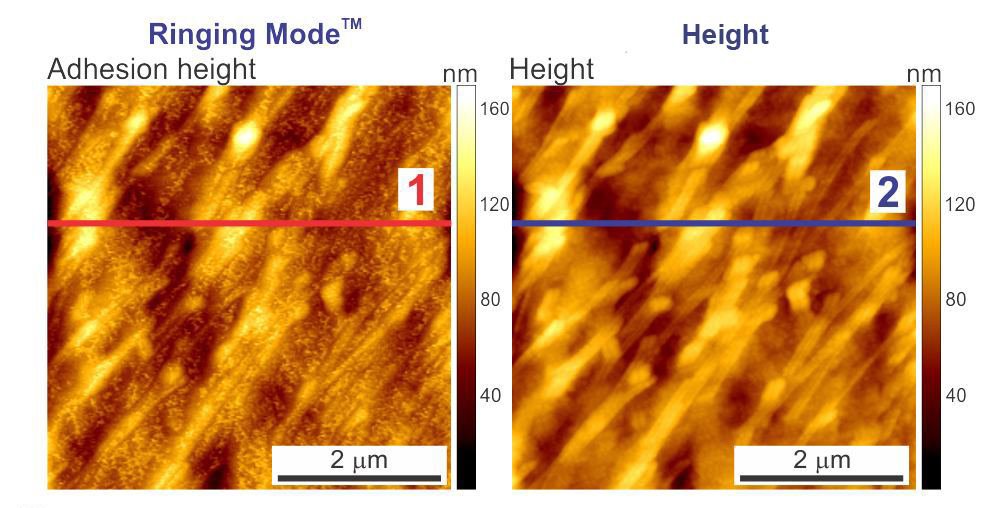
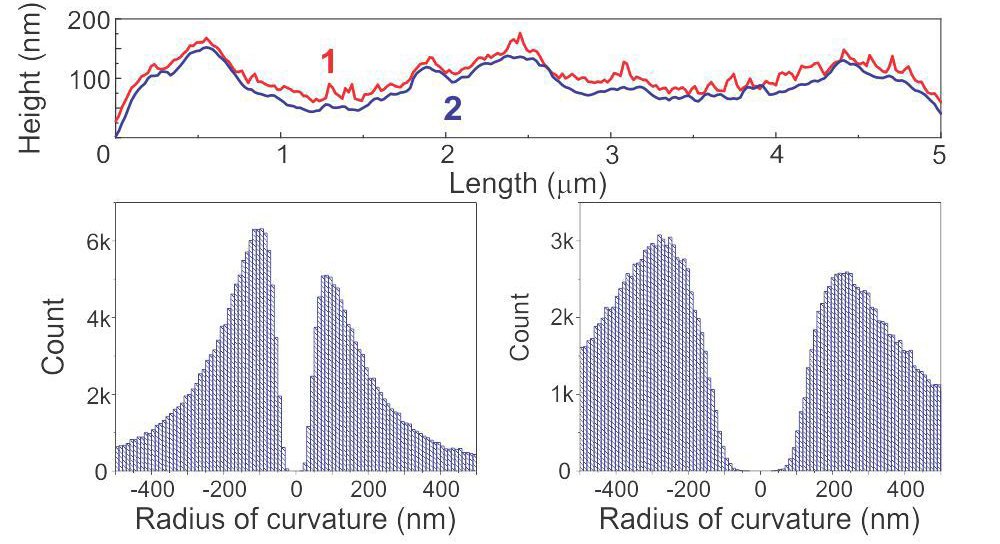
The images below depict the height of a human melanoma cell surface. The image on the left displays adhesion height recorded with Ringing Mode™ while the image on the right presents height recorded with standard imaging modes. The radii of the curvature of the adhesion and standard heights demonstrate the most frequent values observed in both height images.
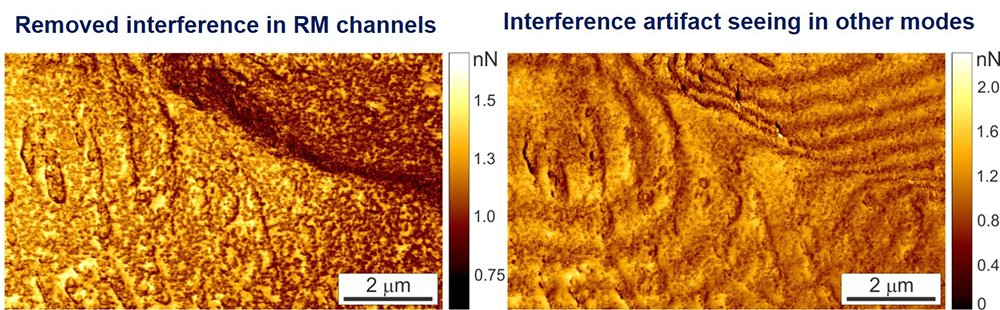
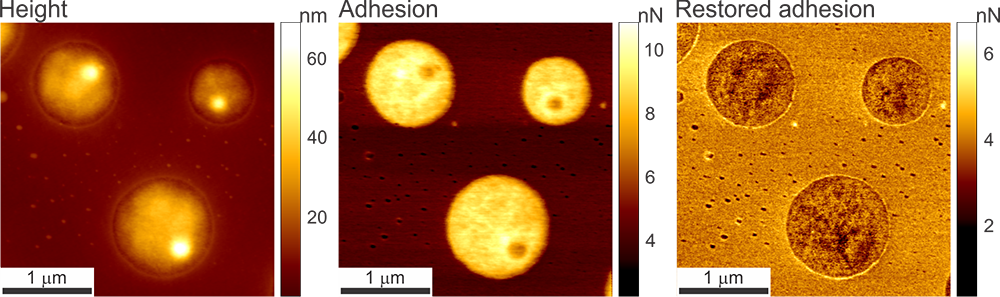
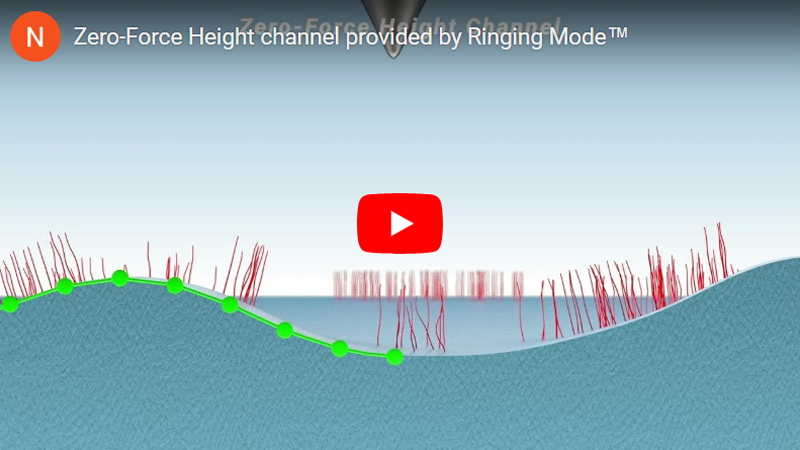
The proprietary algorithm identifies and removes interference artifacts while maintaining the values of measured physical parameters (alteration of values is a common problem with existing filters). Since the ringing occurs at the zero deflection point of the cantilever, the background shift (the cause of the artifact resulting from interference) is easily identified and subsequently corrected.
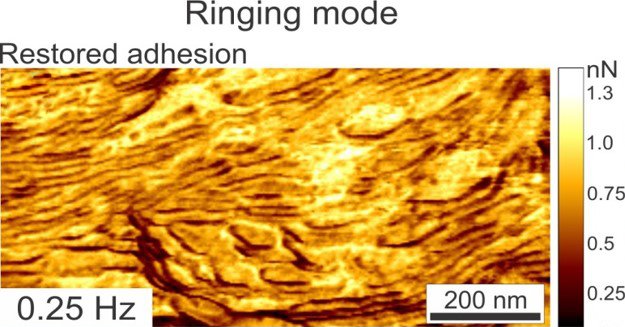
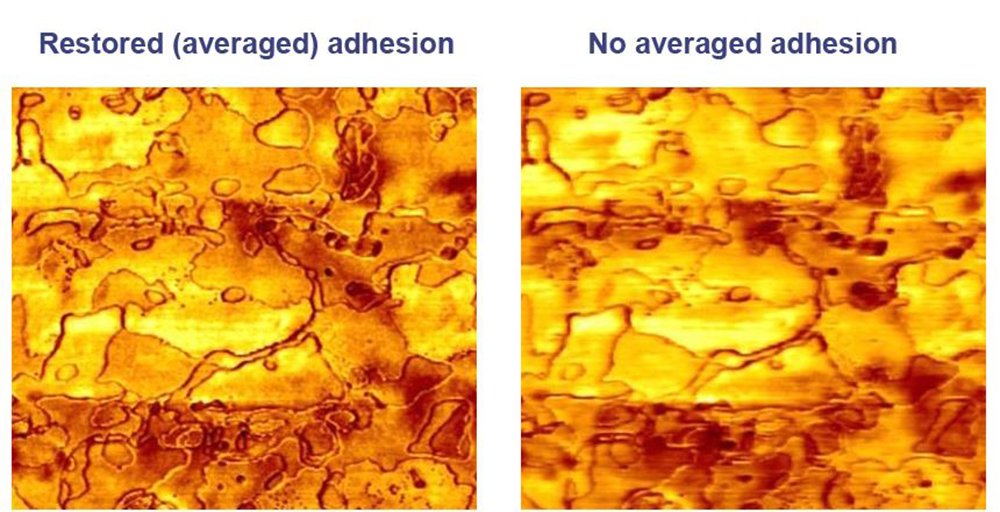
Because the ringing curve contains multiple measurements/data points, the information can be averaged, resulting in a substantial decrease in noise when defining adhesion. We call this parameter “averaged restored adhesion”, or just “restored adhesion”.
What is ringing mode?
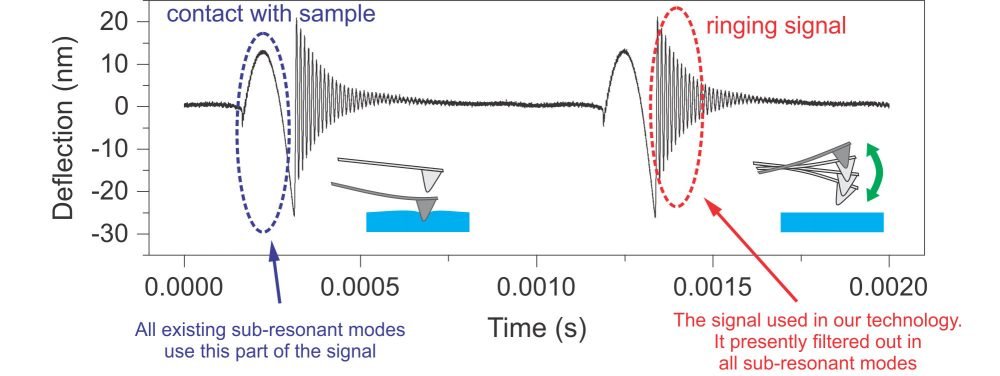
Figure 1
Ringing Mode™ is an extension of sub-resonance tapping modes. It allows for 8 new channels of previously inaccessible physical sample properties to be acquired at the same time. These new channels expand the existing 6 standard sub-resonance image channels to simultaneously provide up to 14 different and complementary data types.
Ringing Mode™ provides new approach for viewing polymers and biomaterials.
NSS has demonstrated successful operation of Ringing Mode™ for imaging in air and in fluid.
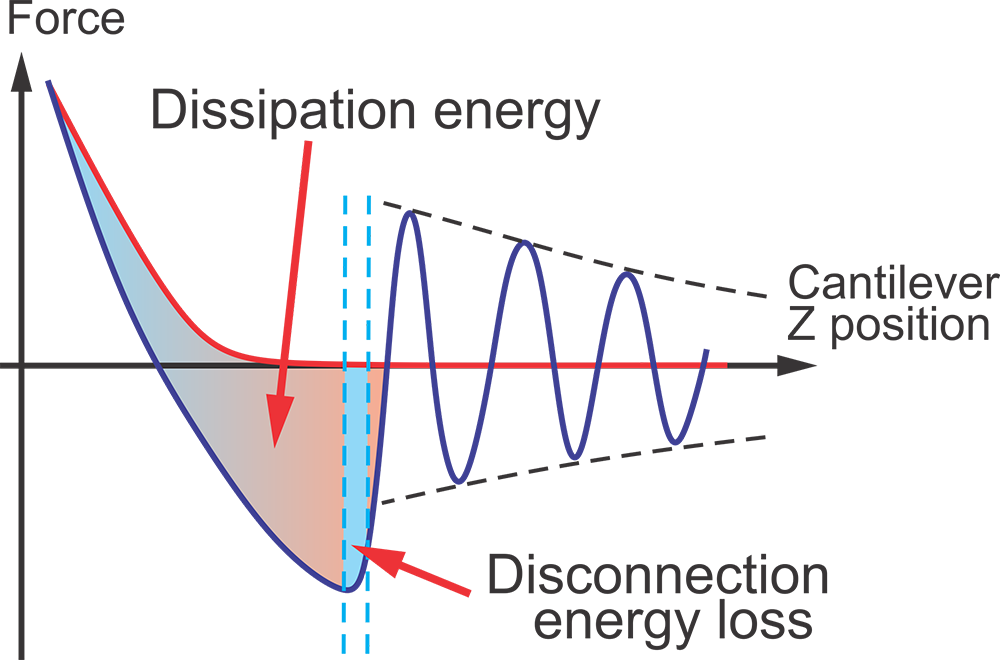
Ringing Mode™ utilizes a portion of the signal received from the AFM cantilever, which was previously regarded as noise, and consequently, filtered out or just ignored. A typical unfiltered signal of an AFM cantilever deflection as a function of time is shown in the figure above. Ringing Mode™ is a combination of an oscillatory non-resonant mode along with a resonant one. It operates with non-resonant feedback while utilizing signal information from the ringing of the AFM cantilever. Such ringing of the cantilever occurs after detaching of the AFM probe from a sample surface due to free resonance oscillations.
A schematic of the signal exploited in Ringing Mode
The analysis of all signals used to derive the information visualized in ringing mode is presented in the figure below.
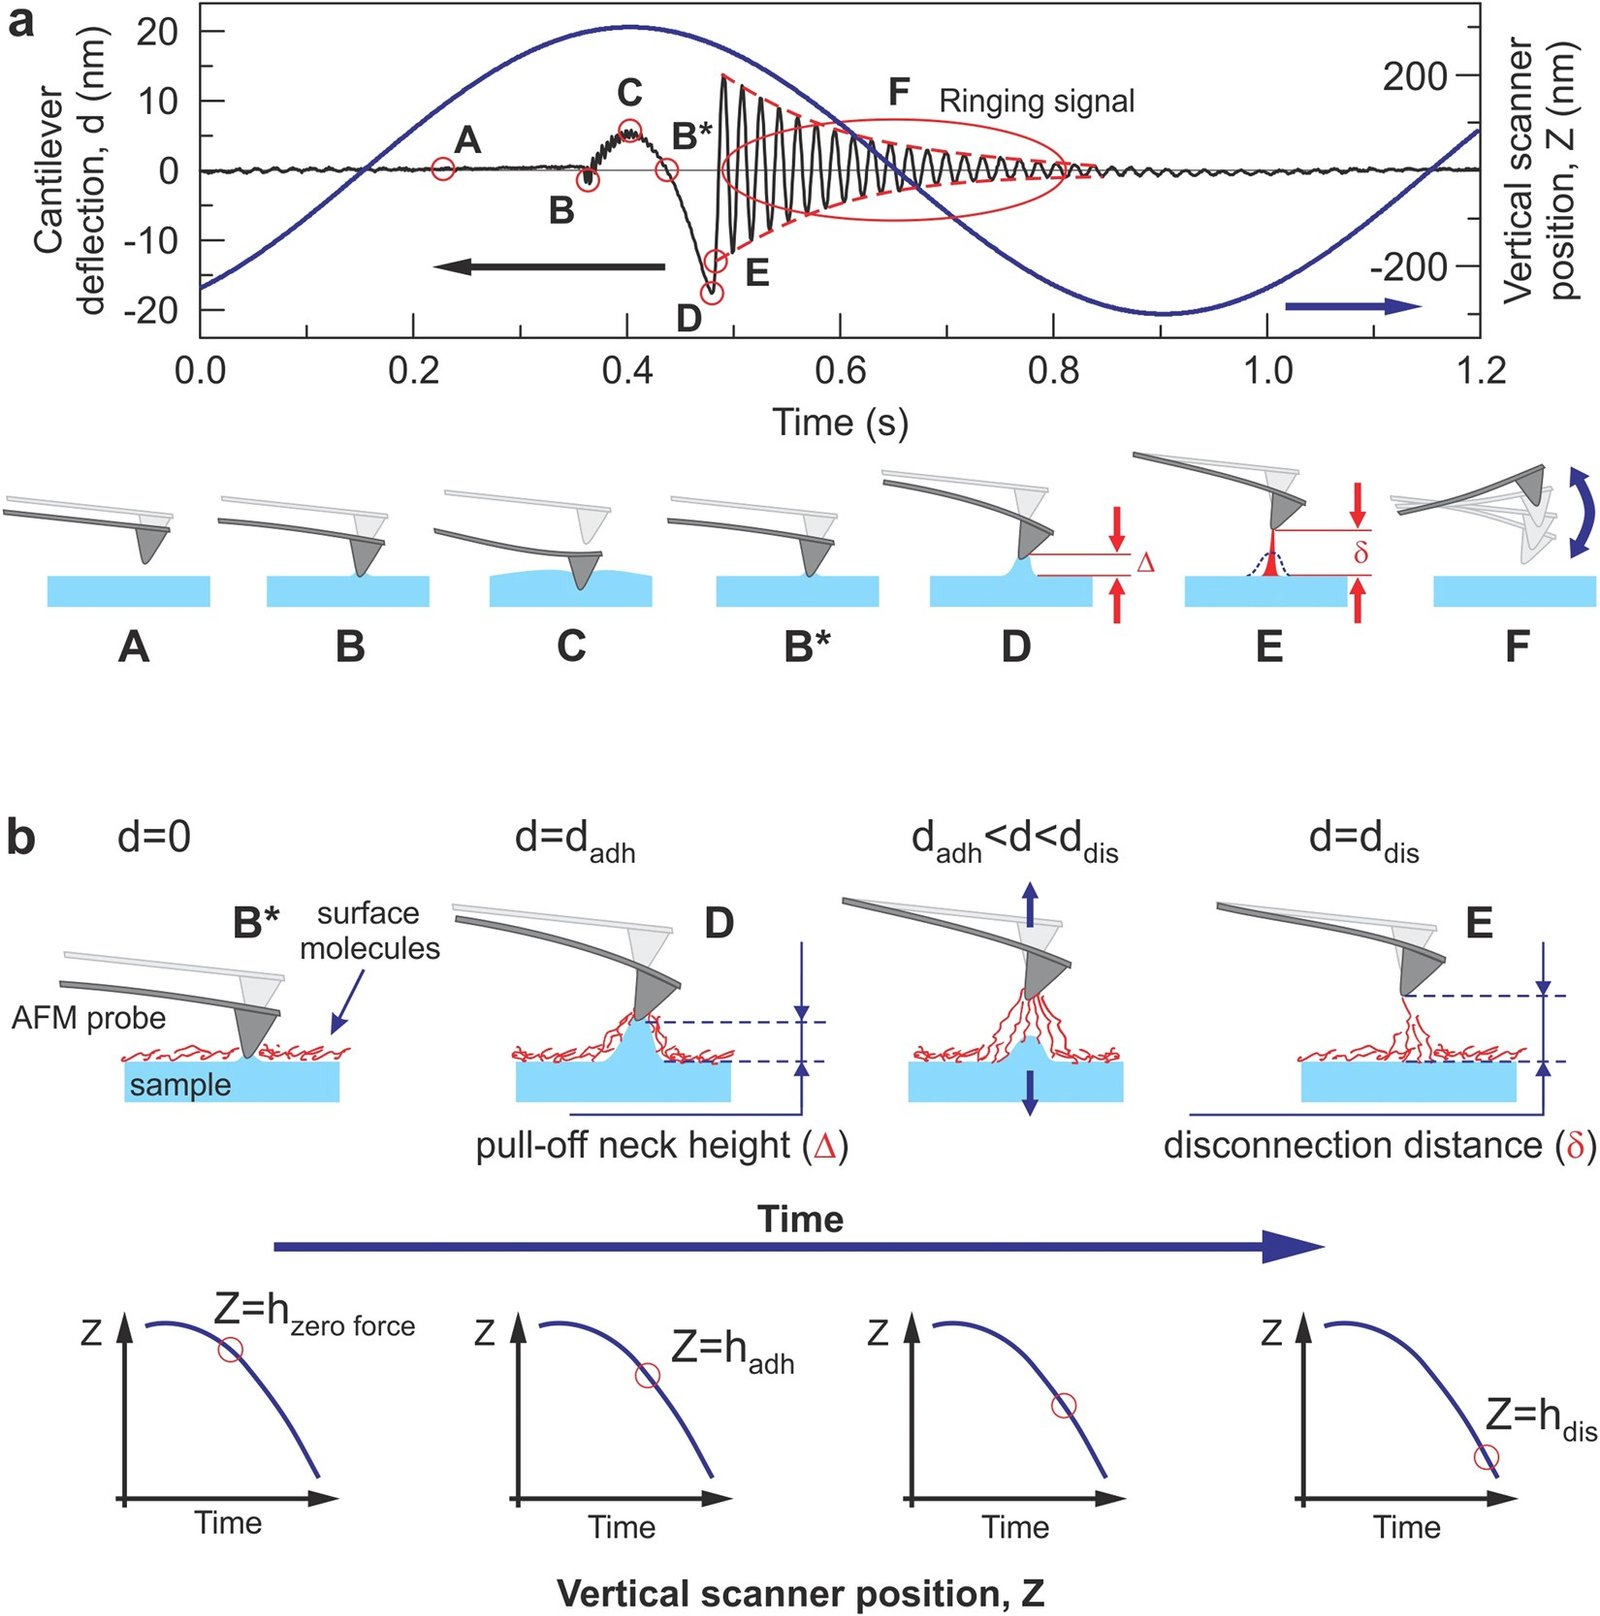 Figure 2
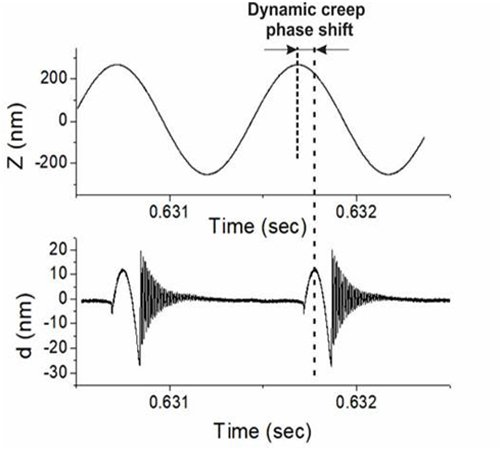
The cantilever deflection d and vertical position of the AFM scanner Z versus time are shown.
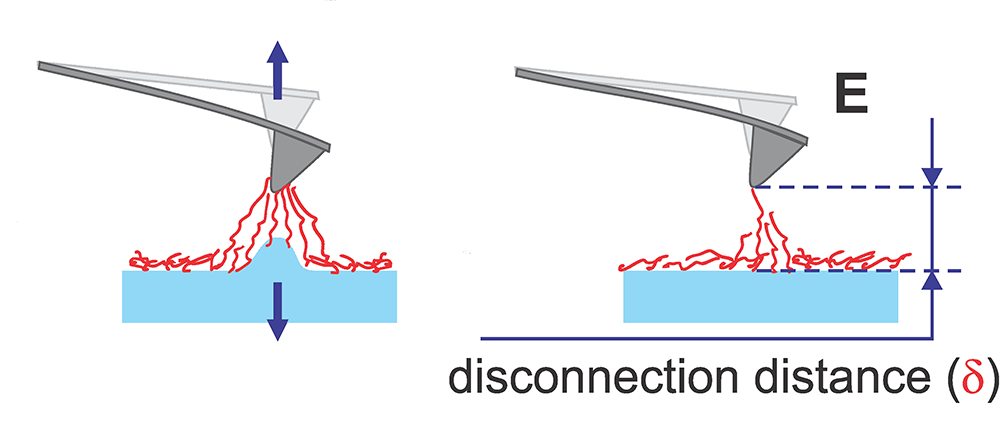
a. One full cycle of 1 kHz vertical oscillation of the Z scanner is presented. A typical unfiltered signal of the cantilever deflection d(or force = kd, where kis the spring constant of the cantilever) as a function of time is shown. The dashed lines show the decrease of the oscillating amplitude of the AFM cantilever due to dissipation. Positive values of the cantilever deflection d are due to forces of repulsion, and vice versa, and negative values stand for the attraction between the AFM probe and sample surface. Specific points during the cantilever motion indicate the following probe positions: (A) far from the sample surface, (B) touches the sample, (C) deforms the sample surface, (B*) touches the surface with zero force when retracting, (D) starts a fast detachment (pull-off) from the sample (the point defining adhesion force), (E) completely detaches from the sample (the point defining the restored adhesion force), (F) starts free oscillations above the sample surface.
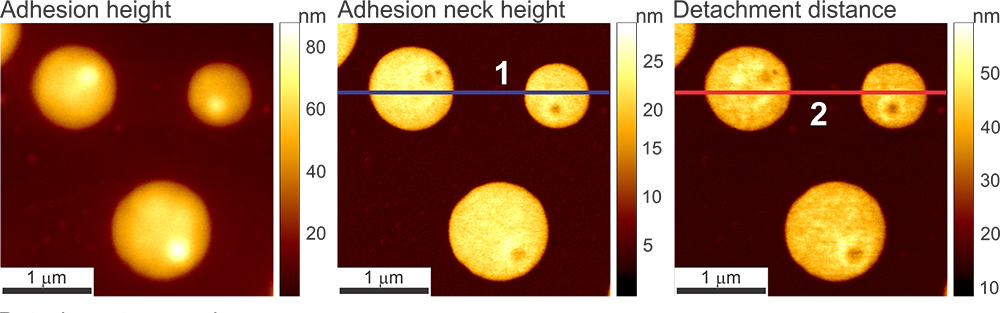
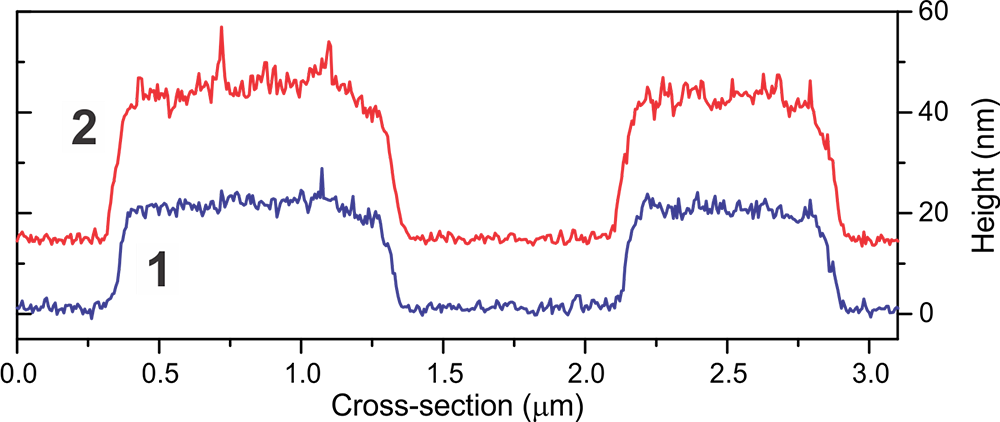
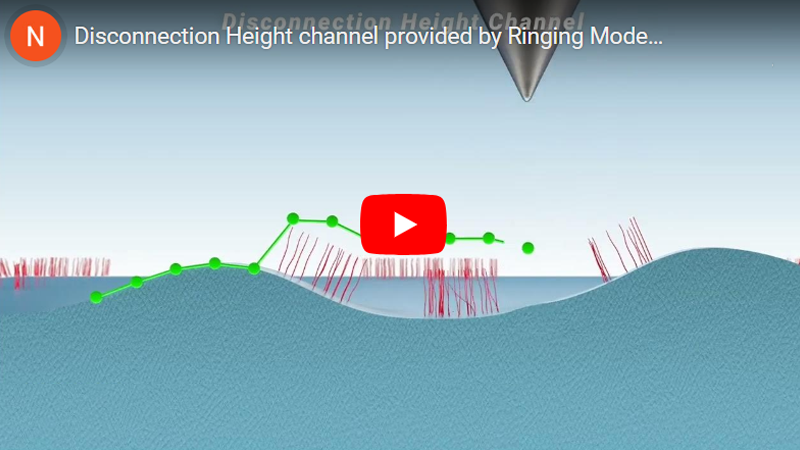
b. Neck height Δ is defined as the size of the neck of the pull-off deformation caused by the AFM probe right before disconnection from the surface; disconnection distance δ is defined as the size of the molecular tails pulled from the surface by the AFM probe during the disconnection from the sample surface.
