An example of plant seeds
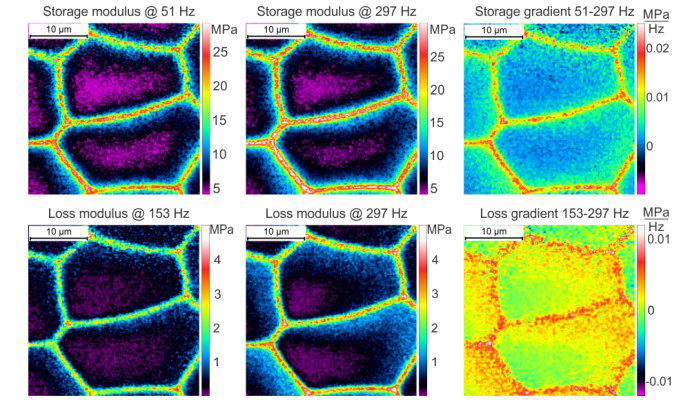
New interesting information seen in the above mechanical maps demonstrates the capability of the FT-nanoDMA method. It dramatically opens a new dimension of study in the mechanics of soft materials at the nanoscale, especially with nanobiomaterials. The FT-nanoDMA method also expands the knowledge base to a scale previously inaccessible. Study of such properties will contribute to achieving fundamental understanding and future advances in the development of new heterogeneous polymers, nanocomposites, biomaterials and cell mechanics.
Resolution of the FT-nanoDMA imaging
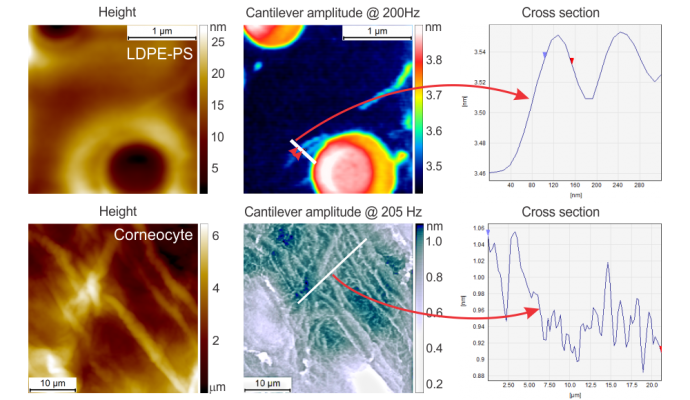
The cantilever amplitude maps, which display the basic signal used to derive the elastic moduli, are shown here because of their better visualization (they have better contrast of small features that demonstrate lateral resolution). The smallest features resolved in these images are of the order of 50 nm for polymers and 70 nm for the corneocytes sample.
Dynamical mechanical spectra (OMS) of LPDE surface measured under fast changing temperature. A sharp drop of the modulus (∼15°C) occurs when adding ethanol (at near-instant heating of the medium [and consequently, the surface]). Examples of DMS for storage and loss moduli at increments of 1.9 sec. are shown at the bottom.


