(nanoindenting AFM extension)
- quantitative nanoindentation (nanoDMA);
- gentle force and fast response of atomic force microscopy (AFM); and
- Fourier transform (FT) spectroscopy.
- Provides a substantially higher spatial resolution (50-150x for lateral and 30-150x for vertical). Such an improvement is comparable to the technological leap of optical to electron microscopy for soft materials.
- Increases the speed (70-180x) of mapping viscoelastic properties of soft materials. In practical terms, this means a reduction in measurement time from hours/ weeks to minutes/hours.
- Enables measurements of mechanical properties of many biological materials, for which measurement time is typically limited.
- Allows for testing of the linearity of strain-stress relation at the nanoscale.
- Provides highly quantitative results.
| Property | TI 950 Hysitron nanoindenter- based nanoDMA | AFM-based FT-nanoDMA |
| Contact diameter | 22,000 or 33,000 nm (PDMS) | 160 or 230 nm (PDMS) |
| 9,000 or 15,000 nm (polyurethane) | 140 or 170 nm (polyurethane) | |
| Minimum vertical indentation | 1000 or 2600 nm (PDMS) | 100 or 400 nm (PDMS) |
| 100 or 300 nm (polyurethane) | 5 or 10 nm (polyurethane) | |
| Total measurement time at one point of the surface | >200 sec (for 10 frequencies) | ~0.7–1 sec (for 10 frequencies though the number of frequencies is not a limiting factor) |
| Time to record 100 × 100 pixel map | 23 days (impractical) | 1.9 hours |
| Ability to study individual biological cells | no | yes |
| Frequency range | Up to 300 Hz | Up to 300 Hz |
The above comparison is done using the same samples of two polymers: PDMS resin (the Young’s modulus of 1.5 MPa) and polyurethane (the Young’s modulus of 0.63 GPa).
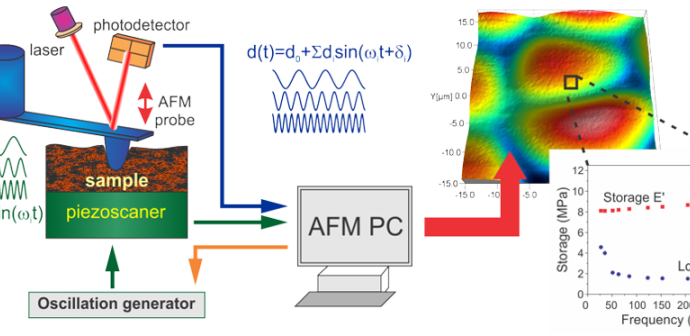
Scheme of FT-nanoDMA setup
An AFM probe indents the sample with a predefined force at each point of the mapped surface. Oscillations of multiple frequencies are simultaneously sent to a piezoscanner that oscillates the sample with total amplitude of z(t). The oscillations are detected through the deflection of the AFM probe d(t). By using the Fourier transformation of the total deflection signal, amplitudes and phase shifts for each frequency can be found. The values of the recorded amplitudes and phases are used to calculate the storage and loss moduli as well as other parameters characterizing the sample.


